
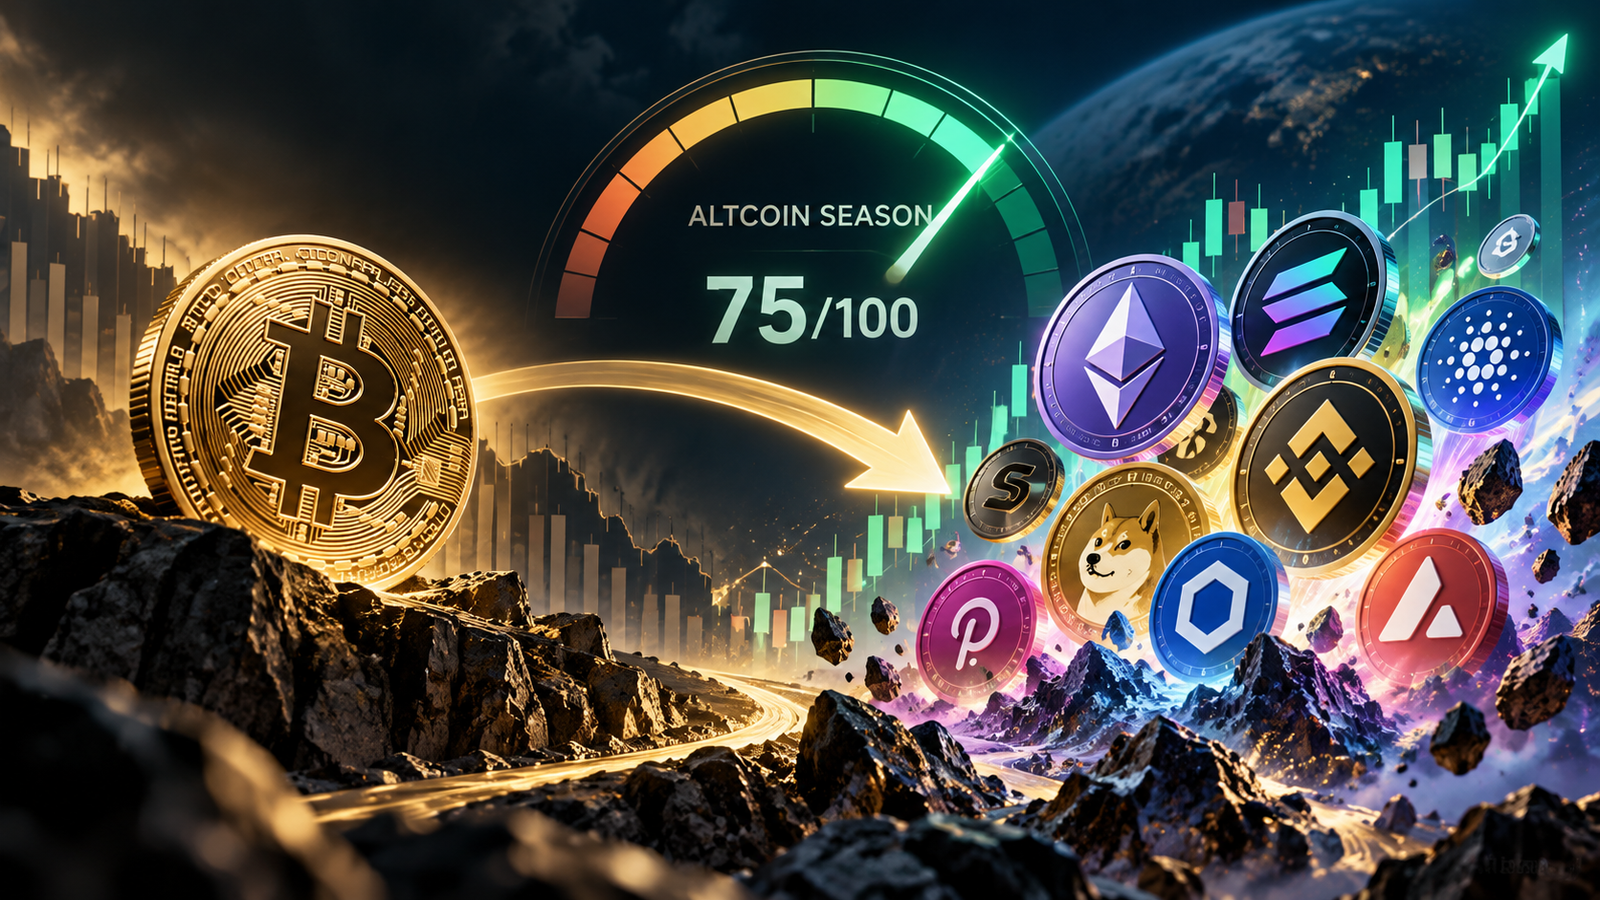
Bitcoin can rise 30% in three months and still underperform much of the crypto market. During certain periods, capital spreads beyond BTC, and a growing number of altcoins deliver stronger returns.
Traders call this altcoin season, or altseason.
The Altcoin Season Index helps measure that shift. Rather than relying on social media enthusiasm or a handful of rapidly rising tokens, the index tracks how many major cryptocurrencies have outperformed Bitcoin over a rolling 90-day period.
A reading of 75 or higher is commonly used to identify an altcoin season. However, the indicator doesn’t forecast future prices, and a high score doesn’t necessarily mean altcoins are making investors money.
Understanding the calculation is essential before using it to evaluate market conditions.
What Is Altcoin Season in Crypto?
Altcoin season describes a period when a broad selection of cryptocurrencies other than Bitcoin outperform BTC.
Ethereum, Solana, XRP, and other major crypto assets may attract greater investor attention as traders pursue opportunities outside the largest cryptocurrency.
But a rally in one or two tokens isn’t enough to establish a market-wide altseason.
Consider the difference between two hypothetical market environments.
In the first, Bitcoin gains 20% over three months while only a few altcoins perform better. The broader market remains relatively Bitcoin-led.
In the second, Bitcoin gains 20%, but most major altcoins rise by 30%, 50%, or more. That represents a broader shift in relative performance.
The Altcoin Season Index is designed to distinguish these conditions using a consistent measurement period.
How Is the Altcoin Season Index Calculated?
The widely followed BlockchainCenter Altcoin Season Index compares the 90-day price performance of the top 50 eligible cryptocurrencies against Bitcoin.
Stablecoins and asset-backed tokens that track other assets are excluded from the comparison.
Each eligible altcoin receives a simple result: it either outperformed Bitcoin or it didn’t.
The index is calculated as:
Altcoin Season Index = (Number of altcoins outperforming BTC ÷ Number of eligible altcoins) × 100
For example, suppose 40 cryptocurrencies are included in a particular calculation.
If 30 outperform Bitcoin over the previous 90 days:
30 ÷ 40 × 100 = 75
The resulting index reading is 75, which meets the commonly used altcoin season threshold.
The index measures the breadth of relative outperformance. It doesn’t measure total market capitalization, trading volume, or the average return across cryptocurrencies.
Altcoin Season Index: Reading the Scale
| Index Reading | Market Classification | Interpretation |
|---|---|---|
| 0–25 | Bitcoin Season | Most tracked altcoins underperformed BTC |
| 26–49 | Neutral | Bitcoin outperformance remains relatively widespread |
| 50–74 | Neutral | More than half of tracked altcoins may be outperforming BTC |
| 75–100 | Altcoin Season | At least 75% of tracked altcoins outperformed BTC |
The important threshold is 75, but a reading of 70 can still indicate substantial altcoin strength.
Likewise, an index of 25 suggests Bitcoin has outperformed most of the comparison group over the preceding 90 days.
These classifications are descriptive, not trading instructions.
What Does an Altcoin Season Index of 75 Mean?
An index reading of 75 means that approximately three-quarters of the eligible cryptocurrencies have delivered higher 90-day returns than Bitcoin.
It doesn’t mean altcoins have increased 75% in value.
Nor does it mean there is a 75% probability that altcoin prices will rise.
The distinction becomes clearer when comparing actual percentage returns.
Example: Calculating Relative Altcoin Performance
Assume Bitcoin gains 15% over 90 days.
| Cryptocurrency | 90-Day Return | Performance vs BTC | Counts Toward Index? |
|---|---|---|---|
| Bitcoin | +15% | Benchmark | No |
| Altcoin A | +42% | +27 percentage points | Yes |
| Altcoin B | +18% | +3 percentage points | Yes |
| Altcoin C | +8% | -7 percentage points | No |
| Altcoin D | +65% | +50 percentage points | Yes |
In this simplified example, three out of four altcoins outperform Bitcoin.
The resulting index would be 75.
Notice that Altcoin C still gained 8% in dollar terms but underperformed Bitcoin by seven percentage points.
This is one of the most important distinctions when evaluating altseason: positive returns and relative outperformance are not the same thing.
Is It Altcoin Season Right Now?
As of October 23, 2026, the BlockchainCenter Altcoin Season Index stood at approximately 53 out of 100.
That places the market in the neutral zone rather than a confirmed altcoin season under its standard 90-day methodology.
Current Altcoin Season Index Snapshot
| Metric | Value |
|---|---|
| Altcoin Season Index | 53/100 |
| Altcoin season threshold | 75 |
| Bitcoin season threshold | 25 |
| Measurement window | 90 days |
| Market classification | Neutral |
| Distance from altseason threshold | 22 index points |
Snapshot date: October 23, 2026. Index values change as the rolling 90-day performance window updates.
A reading of 53 suggests that altcoin outperformance is relatively balanced across the tracked market.
It also shows why market sentiment should not be confused with a confirmed change in relative performance.
Traders may describe the market as entering altseason when selected sectors begin rallying, even though the broader index remains below 75.
Bitcoin Season vs Altcoin Season
The difference between Bitcoin season and altcoin season comes down to which part of the market is outperforming over the selected period.
During Bitcoin season, BTC generally delivers stronger returns than most eligible altcoins.
During altcoin season, relative strength becomes more widespread across alternative cryptocurrencies.
Market Conditions Compared
| Indicator | Bitcoin Season | Altcoin Season |
|---|---|---|
| Altcoin Season Index | 25 or lower | 75 or higher |
| Relative 90-day returns | BTC leads most altcoins | Most tracked altcoins beat BTC |
| Market leadership | Concentrated in Bitcoin | Broader across altcoins |
| BTC dominance | May rise | May decline |
| Altcoin/BTC pairs | Often weaker | More pairs tend to strengthen |
| Market risk | Still substantial | Often higher exposure to volatility |
Bitcoin dominance is relevant, but it is not part of the Altcoin Season Index calculation.
BTC dominance measures Bitcoin’s market capitalization as a percentage of the broader cryptocurrency market.
It can be influenced by stablecoin supply, new token issuance, and price changes across thousands of assets.
The altseason index answers a narrower question: how many selected cryptocurrencies outperformed BTC over the previous 90 days?
How to Identify Altcoin Season Using Three Indicators
The Altcoin Season Index is useful on its own, but combining it with other indicators provides a more detailed view of market rotation.
1. Altcoin Season Index Trend
A single reading tells you where the market stands. The direction of the index provides additional context.
For example:
| Index Movement | Possible Interpretation |
|---|---|
| 20 → 35 → 50 | Altcoin breadth is improving |
| 45 → 60 → 72 | Altcoins are approaching the season threshold |
| 78 → 82 → 85 | Broad outperformance remains established |
| 80 → 60 → 40 | Relative altcoin strength is weakening |
These are illustrative sequences rather than historical index readings.
An index crossing 75 confirms that the 90-day performance condition has been met. It doesn’t establish when the trend started or how long it will continue.
2. Bitcoin Dominance
A sustained decline in BTC dominance can indicate that alternative cryptocurrencies are gaining a larger share of the total crypto market capitalization.
However, dominance movements should be examined alongside actual asset performance.
Bitcoin dominance can fall while both Bitcoin and altcoins are declining in price, provided BTC loses value faster.
For this reason, a declining BTC dominance chart isn’t sufficient evidence of a profitable altcoin rally.
3. Altcoin/BTC Trading Pairs
Comparing altcoin prices against Bitcoin helps isolate relative performance.
Suppose ETH rises 10% in USD terms while BTC gains 25%.
ETH holders made a positive dollar return, but ETH lost value relative to BTC.
A broad improvement across major ALT/BTC pairs can provide additional confirmation that market leadership is shifting.
This is especially useful when the overall crypto market is rising and nearly every asset shows positive USD returns.
Why Altcoins Sometimes Outperform Bitcoin
Market rotation is influenced by liquidity conditions, investor positioning, sector narratives, and differences in risk appetite.
Bitcoin frequently attracts initial attention during major crypto market recoveries because of its liquidity, established market infrastructure, and institutional accessibility.
As market confidence improves, some investors increase exposure to smaller crypto assets in search of higher returns.
Altcoins can experience larger percentage price movements because they often have smaller market capitalizations and thinner trading liquidity.
For example, a $200 million increase in market value represents a much larger proportional change for a $2 billion cryptocurrency than for a $200 billion asset.
That doesn’t mean equal amounts of new investment mechanically create equal increases in market capitalization. Token prices are established through trading, and order-book depth matters.
Altcoin rallies can also be concentrated in particular sectors, such as decentralized finance, AI-related tokens, gaming, or blockchain infrastructure.
A strong sector rally may occur without triggering a full altcoin season across the broader market.
Limitations of the Altseason Index
Although the index offers a straightforward measure of market breadth, it has several weaknesses.
First, the 90-day calculation is backward-looking. A high reading reflects outperformance that has already occurred.
Second, the index treats eligible cryptocurrencies equally when counting outperformers. A relatively small asset can contribute one positive observation just as a much larger asset does.
Third, index providers may use different selection methodologies.
BlockchainCenter typically focuses on the top 50 eligible cryptocurrencies, while CoinMarketCap uses a top-100 approach excluding certain asset categories.
As a result, two providers may publish different readings for the same market.
Finally, the index doesn’t measure investment risk, liquidity quality, or valuation.
An altcoin may outperform Bitcoin over 90 days while remaining far below its previous all-time high.
Can Altcoin Season Happen During a Bear Market?
Yes. The Altcoin Season Index measures performance relative to Bitcoin, not whether the broader market is making positive returns.
Consider the following hypothetical scenario:
| Asset | 90-Day Return |
|---|---|
| Bitcoin | -35% |
| Altcoin A | -15% |
| Altcoin B | -22% |
| Altcoin C | -10% |
| Altcoin D | -40% |
Three of the four altcoins lost less value than Bitcoin.
That produces an illustrative index reading of 75, even though every asset declined in dollar terms.
Investors who interpret a high Altcoin Season Index as an automatic bullish signal could therefore misunderstand the actual market environment.
Checking absolute returns alongside BTC-relative returns avoids this mistake.
How to Use the Altcoin Season Index in Market Analysis
The index is most effective as a market context indicator rather than a standalone buy or sell signal.
A practical analysis might involve:
- Checking the current 90-day Altcoin Season Index.
- Comparing the reading with its trend over recent weeks.
- Reviewing Bitcoin dominance and major altcoin/BTC pairs.
- Identifying which sectors account for the strongest relative returns.
- Evaluating liquidity, volatility, and market capitalization before taking exposure.
A rising index can indicate improving altcoin breadth, but the quality of that movement still matters.
If only highly speculative tokens are attracting volume while established projects remain weak, the market may be experiencing a narrow speculative rotation rather than a sustainable broader trend.
Frequently Asked Questions
What is the Altcoin Season Index?
The Altcoin Season Index measures the percentage of selected major cryptocurrencies that outperformed Bitcoin over the previous 90 days. A reading of 75 or higher is commonly classified as altcoin season.
What does 75 on the Altcoin Season Index mean?
It means at least 75% of the eligible cryptocurrencies delivered better 90-day returns than Bitcoin. It does not mean altcoins gained 75% or that future returns are guaranteed.
How long does altcoin season last?
There is no fixed duration. Altseason conditions can persist for weeks or longer, but the index may move above and below the threshold as relative performance changes.
Is Bitcoin dominance the same as the Altcoin Season Index?
No. Bitcoin dominance measures BTC’s share of total crypto market capitalization. The Altcoin Season Index measures how many selected cryptocurrencies outperform Bitcoin over a rolling period.
Can the index show altcoin season while prices are falling?
Yes. If most tracked altcoins decline less than Bitcoin over 90 days, they can still outperform BTC and produce a high index reading.
How often does the Altcoin Season Index update?
Major index providers generally recalculate their indicators daily using updated market prices and a rolling 90-day performance window.
Is the Altcoin Season Index useful for trading?
It can help assess relative market strength and identify broad rotation trends. However, it is a lagging indicator and should be combined with liquidity, volatility, risk management, and individual asset analysis.