Bitcoin breaks above resistance, open interest jumps 18%, and perpetual futures funding turns sharply positive. At first glance, the move looks bullish. But the same combination can indicate that leveraged traders are piling into longs just as the market becomes vulnerable to a liquidation-driven reversal.
Open interest and funding rate data help distinguish genuine trend participation from potentially overcrowded positioning.
Neither indicator predicts price direction on its own. Their value comes from examining how derivatives exposure changes alongside spot prices, trading volume, and liquidations.
What Is Open Interest in Crypto?
Open interest (OI) measures the number of outstanding futures or options contracts that haven’t been closed or settled.
In crypto derivatives analysis, traders commonly focus on perpetual futures, which have no fixed expiration date.
Every open futures contract has both a long and a short side. Open interest counts the contract once, not twice.
For example, if two traders establish a new contract, OI increases. When an existing contract is closed by both counterparties, OI decreases. If an existing position is transferred to another trader, OI can remain unchanged.
This makes open interest different from trading volume.
| Metric | Open Interest | Trading Volume |
|---|---|---|
| Measures | Outstanding contracts | Contracts traded during a period |
| Time frame | Current outstanding exposure | Defined interval, such as 24 hours |
| Increases when | New contracts are created | Trades are executed |
| Decreases when | Contracts are closed | Does not decrease within the measurement period |
| Main analytical use | Position buildup and reduction | Trading activity and turnover |
Rising OI shows that outstanding derivatives exposure is expanding. It doesn’t reveal whether new traders are predominantly bullish or bearish, because every new long requires a corresponding short.
Funding rates provide additional information about the pricing pressure between those two sides.
What Is a Funding Rate?
Funding rates are periodic payments exchanged between traders holding perpetual futures positions.
They help keep perpetual contract prices aligned with the underlying spot market.
When perpetual futures trade at a premium, funding tends to be positive. When they trade at a discount, funding can become negative.
The payment direction is straightforward:
- Positive funding: longs pay shorts.
- Negative funding: shorts pay longs.
- Funding near zero: the payment imbalance is relatively small.
Funding intervals vary by exchange and contract. Eight-hour settlements are common, but some instruments use four-hour, hourly, or dynamically adjusted intervals.
A positive funding rate doesn’t mean there are more long contracts than short contracts. The two sides are matched by construction.
Instead, it reflects the perpetual market’s pricing and funding mechanism, influenced by demand for leveraged exposure.
How to Interpret Open Interest and Funding Rate Together
Crypto open interest analysis becomes more useful when three variables are considered simultaneously: price direction, change in OI, and funding conditions.
The following matrix summarizes eight commonly observed combinations.
Open Interest, Funding and Price: Market Scenario Matrix
| Price | OI | Funding | Possible Interpretation |
|---|---|---|---|
| Rising | Rising | Positive | Long-side demand is strong; crowded-long risk may be building |
| Rising | Rising | Negative | Bullish price action despite bearish perp pricing; possible short-squeeze setup |
| Rising | Falling | Positive | Price appreciation alongside position reduction; short covering may contribute |
| Rising | Falling | Negative | Shorts may be closing as price rises; bearish positioning is being reduced |
| Falling | Rising | Positive | New exposure during a sell-off; trapped or persistent longs may face pressure |
| Falling | Rising | Negative | Bearish positioning is strengthening; crowded-short risk may develop |
| Falling | Falling | Positive | Long liquidation or position reduction may be underway |
| Falling | Falling | Negative | Bearish exposure may be unwinding alongside declining prices |
These are interpretations, not guaranteed explanations of individual trades.
Funding readings can lag price action, and liquidations can occur on both sides of a market during volatile conditions.
The broader trend, exchange-specific positioning, and actual liquidation data should be checked before assigning a cause.
Rising Open Interest With Positive Funding: Crowded Longs
A market becomes vulnerable to crowded-long positioning when leveraged bullish exposure expands faster than underlying spot demand can support.
Consider a hypothetical Bitcoin rally:
| Metric | Before | After |
|---|---|---|
| BTC price | $80,000 | $84,000 |
| Open interest | $20 billion | $24 billion |
| Funding per 8 hours | +0.01% | +0.06% |
| Price change | — | +5% |
| OI change | — | +20% |
Prices are rising, derivatives exposure is increasing, and longs face higher funding costs.
This suggests strong appetite for leveraged bullish positions.
However, the rising OI in USD also reflects Bitcoin’s higher price. Part of the increase may be valuation-related rather than entirely new contracts.
The warning becomes more meaningful if contract-denominated OI also rises sharply, funding becomes unusually expensive relative to its own history, and spot-market buying fails to keep pace.
Why Crowded Longs Can Be Dangerous
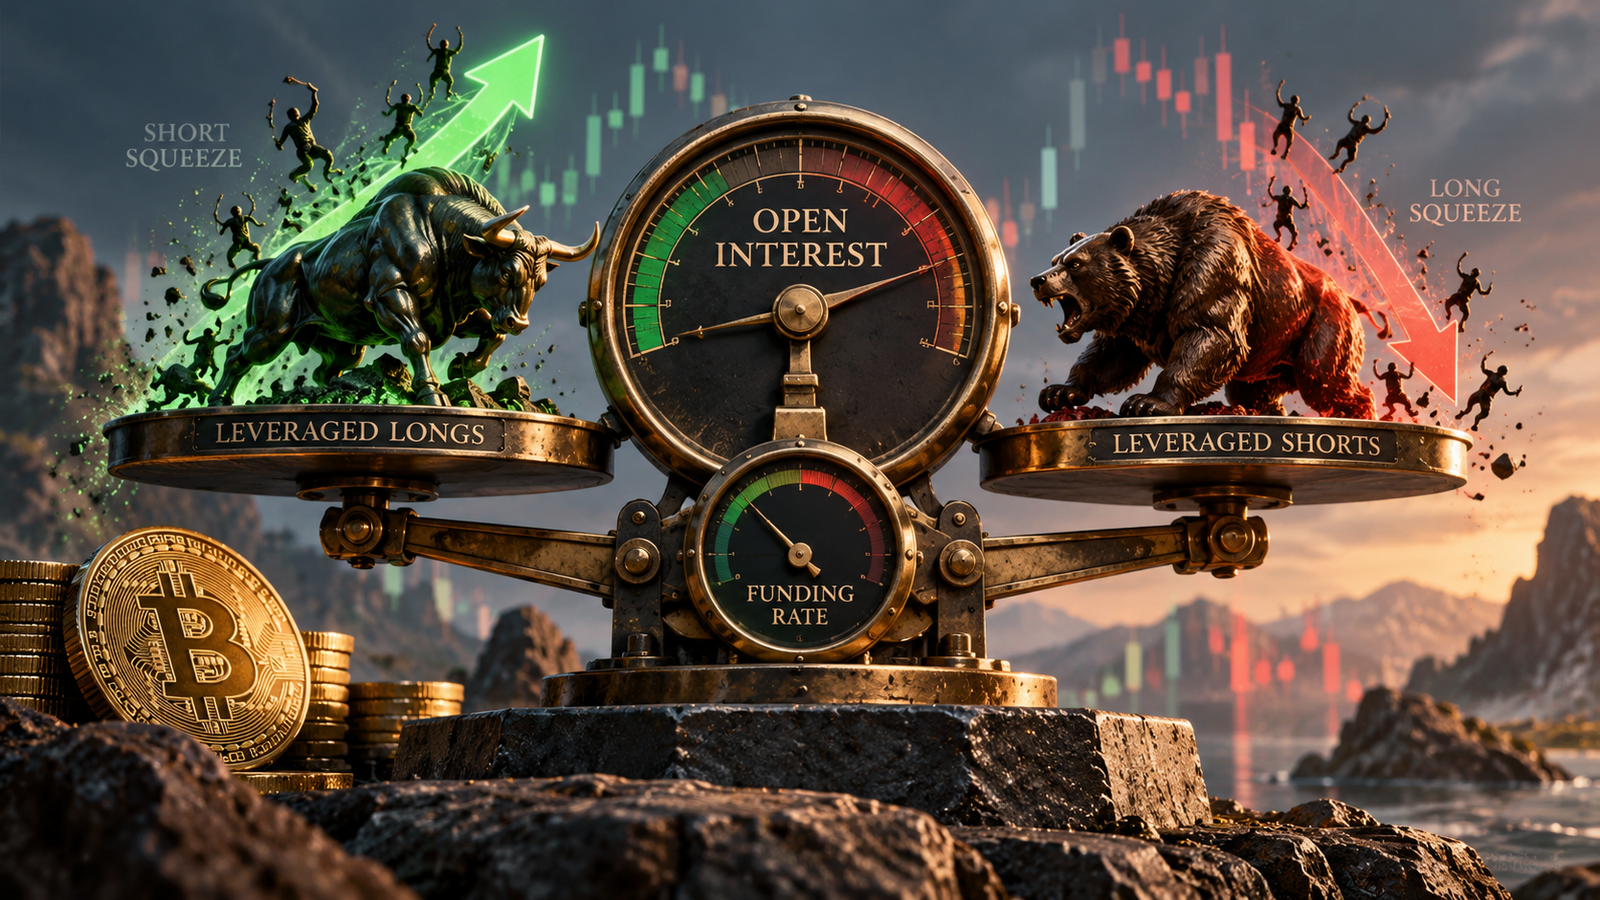
When too many leveraged long positions accumulate near similar entry levels, a modest price decline can trigger forced liquidations.
Those liquidations generate additional selling pressure, potentially pushing prices lower and triggering further liquidations.
This feedback loop is commonly called a long squeeze.
A strongly positive funding rate is not sufficient proof that a long squeeze is imminent. Markets can sustain positive funding through extended bullish trends.
The risk increases when leverage, concentration, and deteriorating price momentum appear together.
Rising Open Interest With Negative Funding: Short-Squeeze Potential
Rising open interest negative funding is one of the more interesting combinations in crypto derivatives markets.
It suggests expanding outstanding exposure while perpetual contracts are priced in a way that causes shorts to pay longs.
Suppose Bitcoin trades near $75,000 while OI increases 15% and funding falls to -0.04% per eight-hour interval.
The bearish positioning pressure may be substantial.
If Bitcoin then breaks above resistance on strong spot buying, short sellers could be forced to close positions.
Closing a short generally involves buying back the contract. A wave of short covering and liquidations can accelerate the upward move.
This is the mechanism behind a short squeeze.
Signs That Strengthen a Short-Squeeze Setup
Negative funding becomes more relevant when accompanied by:
- Rising contract-denominated open interest.
- A sustained price recovery or resistance breakout.
- Strong spot trading volume.
- Short liquidations appearing as prices accelerate.
- Persistent bearish derivatives positioning despite improving price action.
Without price confirmation, increasing OI and negative funding can simply reflect a developing downtrend.
Short squeezes are possibilities created by market structure, not automatic consequences of negative funding.
Falling Open Interest: Liquidations or Voluntary Position Closures?
Declining OI means outstanding derivatives contracts are being reduced.
That can happen through voluntary position closures, liquidation events, contract settlement, or other offsetting activity.
The price direction helps narrow the interpretation.
If prices fall sharply while OI contracts, leveraged longs may be exiting or getting liquidated.
If prices rise while OI declines, short covering may be contributing to the rally.
However, OI alone cannot establish whether a position was closed voluntarily or forcibly.
Liquidation data provides another useful layer.
For example, falling BTC prices, a sudden contraction in OI, and a spike in long liquidations together provide stronger evidence of long-side deleveraging than falling OI alone.
After a substantial liquidation event, reduced leverage can change market conditions, but it does not guarantee an immediate recovery.
Open Interest in USD vs Contracts: Why the Difference Matters
One of the biggest mistakes in open interest analysis is interpreting every increase in USD-denominated OI as evidence of new positions.
Some platforms display OI in the underlying asset, contract counts, or US dollar notional value.
A change in the underlying cryptocurrency’s price can affect the dollar value of outstanding exposure even when the number of contracts stays constant.
Numerical Example: OI Increases Without New Contracts
Assume a BTC perpetual futures market has 10,000 outstanding contracts, each representing 0.01 BTC.
Total BTC exposure:
10,000 × 0.01 = 100 BTC
Now consider how USD-denominated open interest changes.
| Metric | Initial | After BTC Price Rise |
|---|---|---|
| Outstanding contracts | 10,000 | 10,000 |
| BTC per contract | 0.01 | 0.01 |
| Total BTC exposure | 100 BTC | 100 BTC |
| BTC price | $80,000 | $88,000 |
| OI in USD | $8 million | $8.8 million |
| Change in contract count | — | 0% |
| Change in USD OI | — | +10% |
Open interest expressed in dollars rises by 10%, even though not a single additional contract has been created.
The entire increase comes from the higher BTC price.
This example assumes a fixed amount of BTC per contract.
Not every derivatives contract uses this structure. Some inverse or fixed-dollar contracts have different specifications, so a contract count cannot always be compared directly with underlying-coin exposure.
Before analyzing OI, check whether the data provider reports contracts, base-asset quantity, or USD notional exposure.
Aggregated OI across multiple exchanges may also mix instruments with different contract specifications.
How Much Does Funding Cost a Leveraged Position?
Funding can materially affect trading returns when positions remain open through multiple settlement intervals.
For a simplified example, consider a $50,000 perpetual futures position with funding fixed at +0.05% every eight hours.
The long position pays:
$50,000 × 0.0005 = $25 per funding interval.
If the position remains open through three such intervals:
$25 × 3 = $75 per day.
Over seven days:
$75 × 7 = $525.
| Holding Period | Hypothetical Funding Paid |
|---|---|
| One 8-hour interval | $25 |
| 24 hours | $75 |
| 3 days | $225 |
| 7 days | $525 |
This calculation assumes constant position notional, an unchanged funding rate, and three settlements per day.
Real funding rates fluctuate, and the payment is based on the position value and the applicable exchange methodology at settlement.
Trading fees, slippage, and liquidation costs are excluded.
Leverage does not directly multiply the funding rate applied to notional exposure, but it can make that cost substantial relative to the trader’s posted margin.
How to Spot a Long Squeeze or Short Squeeze
A squeeze is more convincing when price action, falling OI, and liquidation data tell a consistent story.
Short Squeeze
A typical short-squeeze sequence might involve:
- Negative funding and elevated outstanding exposure.
- Price breaking above a heavily defended resistance level.
- Short positions closing or being liquidated.
- OI contracting as buying pressure accelerates.
The resulting price increase may be fast, but it can lose momentum once forced buying subsides.
Long Squeeze
A long-squeeze sequence often has the opposite structure:
- Strongly positive funding and expanding leveraged exposure.
- Price losing support after an extended rally.
- Forced long liquidations adding sell pressure.
- Rapidly declining OI during the sell-off.
Not every large price movement with falling OI is a squeeze. Liquidation evidence and timing matter.
Where to Find Crypto Open Interest and Funding Data
Several trading and analytics platforms provide derivatives positioning metrics.
| Platform | Useful Data | Practical Use |
|---|---|---|
| CoinGlass | Aggregated OI, funding, liquidations | Cross-exchange derivatives monitoring |
| Binance Futures | Contract-level OI and funding history | Exchange-specific positioning |
| Bybit | Funding, contract specifications, OI | Comparing perpetual markets |
| TradingView | Price charts and selected derivatives data | Aligning price structure with OI |
| Exchange APIs | Historical contract and funding records | Quantitative research |
Aggregated dashboards are convenient, but they require care.
Exchanges may use different funding intervals, contract denominations, and reporting conventions.
A funding rate of +0.01% per hour is not directly equivalent to +0.01% every eight hours.
For meaningful comparisons, normalize funding rates to a common interval and verify the underlying instrument.
A Practical Open Interest and Funding Rate Checklist
Before interpreting a derivatives market signal, examine the following:
- Is price rising, falling, or consolidating?
- Is open interest increasing in contracts or only in USD notional value?
- Is funding positive, negative, or unusually high relative to recent history?
- Are liquidations occurring alongside the change in OI?
- Is spot volume confirming the price movement?
- Are similar positioning conditions visible across major exchanges?
- Does the move occur near an important support or resistance level?
The final question is especially relevant.
Elevated positive funding during a breakout supported by sustained spot demand can have a different implication from equally elevated funding after a rally begins losing momentum.
Derivatives positioning should be evaluated within market structure, rather than converted into a mechanical buy or sell signal.
Frequently Asked Questions
What does rising open interest and positive funding mean?
It generally suggests expanding derivatives exposure with bullish perpetual-market pricing pressure. If funding becomes unusually high, crowded-long risk may increase, but the combination does not guarantee a reversal.
Is rising open interest with negative funding bullish?
Not automatically. It can indicate growing bearish derivatives pressure. A short-squeeze opportunity becomes more plausible if price starts rising despite negative funding and short liquidations subsequently appear.
Does high open interest mean more longs than shorts?
No. Every open futures contract has both a long and short counterparty. High OI indicates substantial outstanding exposure, not a numerical imbalance between long and short contracts.
Can open interest rise while traders close positions?
Yes, if more new contracts are created than existing contracts are closed. USD-denominated OI can also increase solely because the underlying asset price rises.
What happens when funding rates turn negative?
In a conventional perpetual funding arrangement, traders holding short positions pay traders holding long positions at the applicable settlement time.
What is the difference between a long squeeze and a short squeeze?
A long squeeze involves forced selling or rapid closure of leveraged long positions during a decline. A short squeeze involves forced buying or closure of short positions during a rally.
Are funding rates reliable trading indicators?
They are useful for understanding derivatives pricing and positioning pressure but cannot predict price direction independently. Funding should be combined with price, OI, volume, and liquidation data.
Why do different platforms show different open interest figures?
Differences may arise from exchange coverage, contract types, settlement currencies, instrument specifications, aggregation methods, and whether open interest is shown in contracts, underlying assets, or USD notional value.