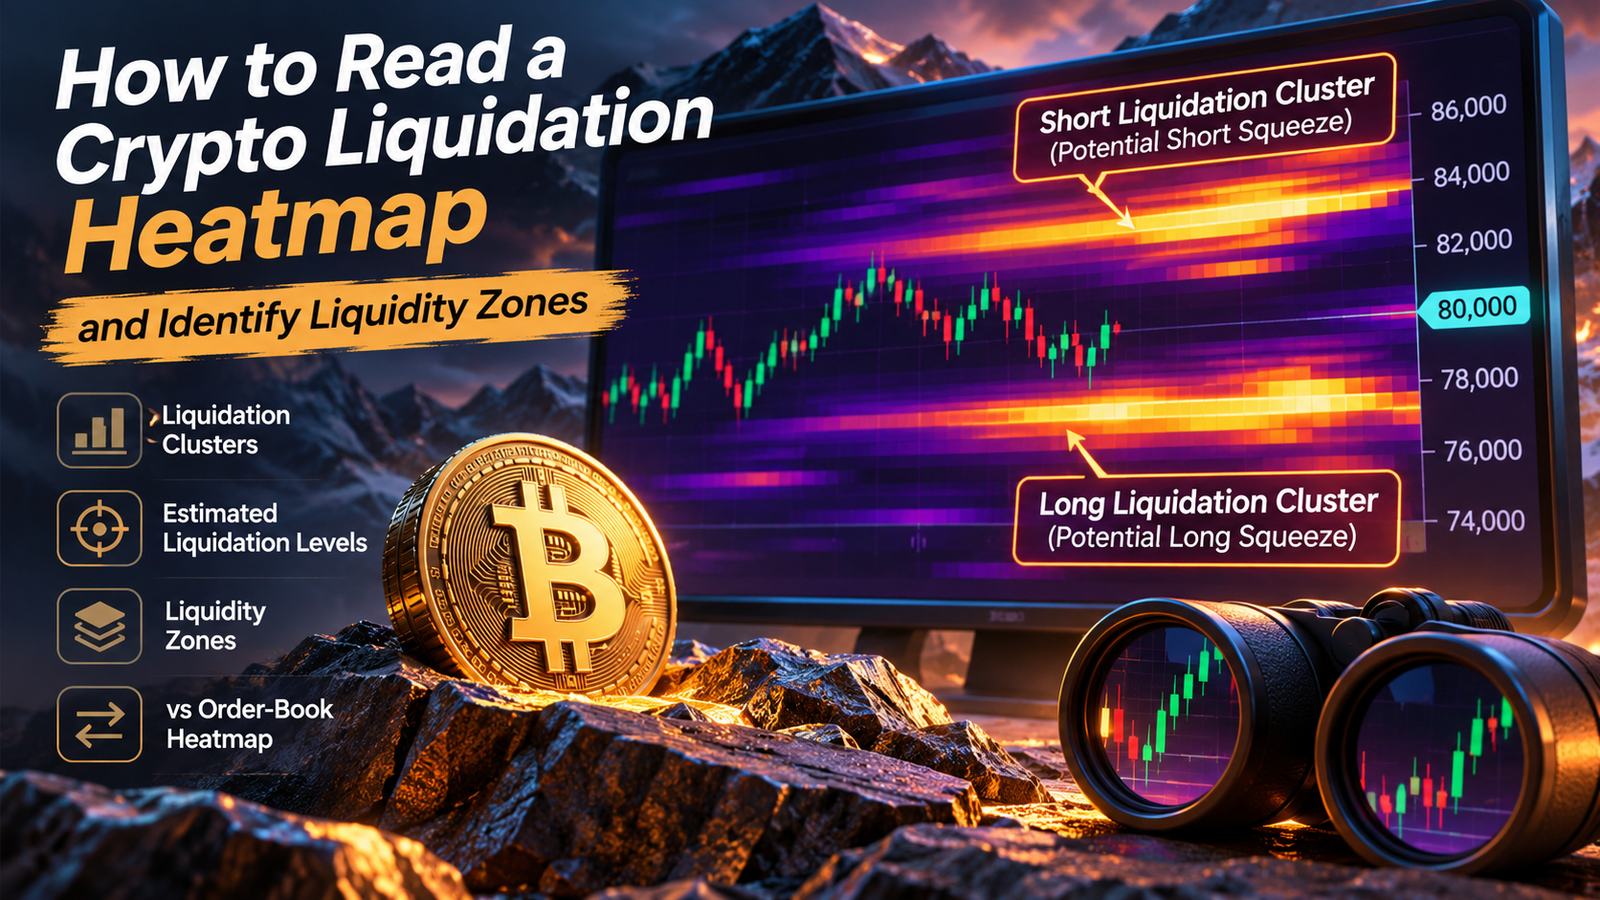
Bitcoin trades at $80,000, but a liquidation heatmap shows a bright band near $83,000 and another around $77,000. These zones suggest that significant leveraged positions could face forced closure if the market reaches those prices.
Traders often interpret such clusters as potential price targets. The problem is that liquidation heatmaps don’t reveal the exact positions held by every market participant, and highlighted levels can disappear before price approaches them.
A useful heatmap analysis starts with understanding what the colors represent, how liquidation prices are estimated, and whether derivatives positioning supports a potential squeeze.
What Is a Crypto Liquidation Heatmap?
A crypto liquidation heatmap visualizes estimated price levels where leveraged futures positions may be liquidated.
Liquidation occurs when a trader’s margin is no longer sufficient to maintain an open position under an exchange’s risk requirements.
For a leveraged long position, liquidation risk generally increases as price falls. For a short position, liquidation risk increases as price rises.
Analytics platforms estimate where these positions could be forced to close and display the results as horizontal price zones.
Brighter areas typically represent larger estimated concentrations of potential liquidations. Darker areas suggest fewer estimated liquidations under the provider’s model.
The map is not a list of actual liquidation orders waiting to execute.
Exchanges generally do not publish every trader’s entry price, collateral, leverage, and liquidation threshold. Heatmap providers therefore use market data and assumptions to estimate liquidation concentrations.
How to Read Liquidation Heatmap Colors and Clusters
Most liquidation heatmaps place time on the horizontal axis and price on the vertical axis.
Colored horizontal bands indicate areas where the model estimates that leveraged positions could face liquidation.
Understanding the Main Heatmap Elements
| Heatmap Element | What It Represents | How to Interpret It |
|---|---|---|
| Bright yellow or warm-colored bands | High estimated liquidation concentration | Potential zone of stronger liquidation activity |
| Dark blue or purple areas | Lower estimated concentration | Fewer modeled liquidation levels |
| Cluster above current price | Potential short liquidations | Forced buying may occur if price rises into the zone |
| Cluster below current price | Potential long liquidations | Forced selling may occur if price falls into the zone |
| Extending horizontal band | Persistent modeled liquidation concentration | Potentially relevant level that should be monitored |
| Fading or disappearing band | Lower estimated concentration | Positions may have changed or the model may have updated |
Color schemes vary between platforms. A yellow band on one dashboard isn’t necessarily equivalent to a yellow band on another.
The most useful approach is to compare concentrations within the same chart, using the same exchange coverage and calculation settings.
What Is a Liquidation Cluster?
A liquidation cluster is a price range containing a relatively high concentration of estimated liquidation levels.
Suppose a heatmap shows several strong bands between $82,500 and $83,200 while Bitcoin trades at $80,000.
That area may represent a concentration of short positions vulnerable to liquidation if BTC rises.
If forced short closures begin, exchanges may execute buy orders to reduce those positions. Such buying can amplify an existing upward move.
The reverse applies below market price, where forced long closures may introduce additional selling pressure.
A cluster represents potential conditional activity, not guaranteed buying or selling volume.
How Are Bitcoin Liquidation Levels Estimated?
Liquidation prices depend on leverage, collateral, entry price, maintenance margin, and exchange-specific risk rules.
Higher leverage generally places a position’s liquidation threshold closer to its entry price, assuming comparable collateral arrangements.
A simplified example shows how this works.
Bitcoin Liquidation Levels by Leverage
Assume a trader opens a BTC perpetual futures position at $80,000. Ignore maintenance margin, fees, additional collateral, and other contract-specific adjustments.
| Leverage | Approximate Long Liquidation | Approximate Short Liquidation | Adverse Price Move |
|---|---|---|---|
| 5× | $64,000 | $96,000 | 20% |
| 10× | $72,000 | $88,000 | 10% |
| 20× | $76,000 | $84,000 | 5% |
| 50× | $78,400 | $81,600 | 2% |
| 100× | $79,200 | $80,800 | 1% |
The simplified formulas are:
Long liquidation estimate = Entry price × (1 − 1 / Leverage)
Short liquidation estimate = Entry price × (1 + 1 / Leverage)
Real exchange liquidation thresholds differ because maintenance margin, position size, funding payments, collateral changes, and liquidation rules affect the calculation.
Many exchanges use a mark price rather than the last traded price to determine liquidation triggers.
For this reason, liquidation heatmaps should be interpreted as modeled risk distributions rather than precise account-level forecasts.
How Liquidation Heatmaps Identify Potential Liquidity Zones
Liquidation clusters are often described as liquidity zones because forced closures can generate trading activity.
However, liquidation-driven liquidity differs from ordinary resting orders.
An estimated $200 million liquidation cluster doesn’t mean $200 million of immediately executable buy or sell orders is already available at that price.
It means the model estimates that positions representing a particular amount of exposure could face liquidation under certain conditions.
Hypothetical BTC Heatmap Example
Assume Bitcoin trades at $80,000.
| Price Zone | Estimated Liquidation Exposure | Likely Vulnerable Side | Distance From Current Price |
|---|---|---|---|
| $84,000–$85,000 | $350 million | Shorts | +5.0% to +6.25% |
| $82,000–$82,500 | $180 million | Shorts | +2.5% to +3.13% |
| $78,000–$78,500 | $240 million | Longs | -2.5% to -1.88% |
| $75,000–$76,000 | $420 million | Longs | -6.25% to -5.0% |
These figures are hypothetical and illustrate relative concentration.
The largest modeled cluster sits below the market at $75,000–$76,000.
That doesn’t mean Bitcoin must fall toward it. Price direction still depends on actual demand, supply, market structure, and changing positioning.
In practice, a smaller nearby cluster can be reached while a much larger distant cluster remains untouched.
Liquidation Heatmap vs Order-Book Heatmap
These tools are often confused because both use colored zones to display market concentrations.
Their underlying data is fundamentally different.
| Feature | Liquidation Heatmap | Order-Book Heatmap |
|---|---|---|
| Main purpose | Estimate potential forced-liquidation zones | Display resting limit-order liquidity |
| Data basis | Derivatives positioning models and market data | Exchange order-book data |
| Shows actual resting orders | No | Yes, within the visible order book |
| Price levels | Estimated liquidation thresholds | Posted bid and ask prices |
| Main limitation | Position estimates may be inaccurate | Orders can be canceled or moved |
| Typical use | Leverage and squeeze analysis | Execution liquidity and order-flow analysis |
An order-book heatmap displays limit orders that market participants have submitted.
These orders can provide liquidity if they remain in the book when price reaches them.
A liquidation heatmap instead estimates where forced position closures might occur.
It does not show the exact amount of executable liquidity available before a liquidation is triggered.
Both tools are dynamic. Resting orders can disappear, and traders can close or adjust leveraged positions before their estimated liquidation levels are reached.
Why Price Sometimes Moves Toward Liquidation Clusters
Large concentrations of leveraged positions can contribute to rapid price movements when the market approaches them.
Suppose Bitcoin is rising toward a cluster of short liquidation levels.
As price moves higher, some short sellers voluntarily close positions. Others may be forcibly liquidated when their margin becomes insufficient.
Both processes can contribute to buying activity.
If that buying pushes price into additional short liquidation levels, the move may accelerate.
This is a short squeeze.
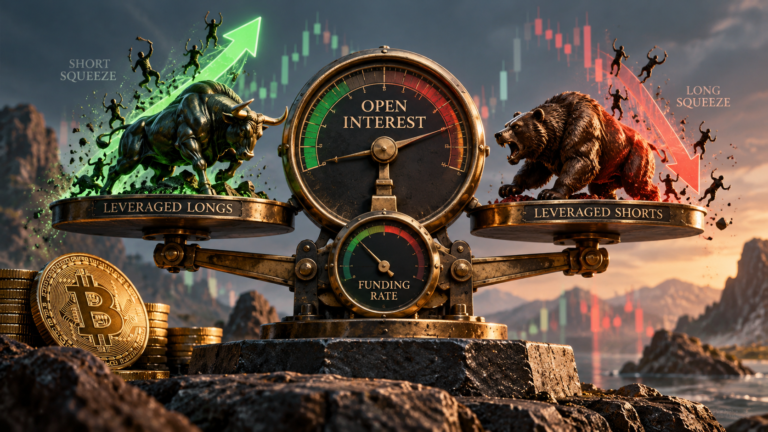
A long squeeze operates in the opposite direction. Falling prices trigger long liquidations, which may create further selling pressure.
However, liquidations usually amplify an existing move rather than explain every initial price movement.
A catalyst such as aggressive spot buying, a macroeconomic announcement, or a large derivatives order may be needed to push price toward the cluster.
Why Price Doesn’t Have to Reach Every Liquidation Cluster
Bright heatmap bands are not guaranteed price targets.
Several factors can prevent a projected liquidation event from occurring.
Positions Can Be Closed Before Liquidation
Traders can reduce exposure, close positions, or add collateral before reaching liquidation.
An estimated cluster may therefore weaken or disappear without ever producing a major liquidation event.
Market Direction Can Change
Strong buying or selling pressure can reverse the market before a nearby liquidation zone is reached.
A large cluster below Bitcoin doesn’t override a sustained uptrend supported by spot demand.
Heatmap Models Have Limited Information
Providers estimate liquidation levels using available market information and assumptions about leverage and positioning.
Actual positions may have different entry prices, collateral balances, and risk settings.
Cross-margin arrangements and portfolio offsets can make precise estimates particularly difficult.
Liquidation Levels Change Over Time
Funding payments, collateral adjustments, new positions, and position closures can all affect liquidation risk.
A heatmap captured several hours ago may no longer reflect current positioning.
The idea that market makers must collect every visible liquidation cluster is therefore too simplistic.
Four Common Liquidation Heatmap Scenarios
The relationship between price and liquidation concentrations can help frame potential market behavior.
| Scenario | Market Conditions | What to Watch |
|---|---|---|
| Short squeeze setup | Large estimated short cluster above price | Rising price, short liquidations, spot buying |
| Long squeeze setup | Large estimated long cluster below price | Support breakdown, falling OI, long liquidations |
| Cluster rejection | Price approaches a strong zone but reverses | Weak momentum, fading volume, position changes |
| Cluster absorbed | Price moves through a zone without major acceleration | Actual liquidations, trading volume, continuation |
A heatmap becomes more informative when these scenarios are compared with actual market behavior.
For example, a breakout into a short-liquidation zone accompanied by significant short liquidations provides stronger evidence of a squeeze than a breakout without liquidation activity.
Combining Liquidation Heatmaps With Open Interest and Funding
Liquidation heatmaps work best when interpreted alongside derivatives positioning.
Open interest measures outstanding futures exposure. Funding rates indicate the pricing pressure between perpetual futures and the underlying market.
Three-Indicator Comparison
| Heatmap Signal | Open Interest | Funding Rate | Possible Interpretation |
|---|---|---|---|
| Large short cluster above price | Rising | Negative | Bearish positioning may be expanding |
| Large long cluster below price | Rising | Positive | Leveraged bullish exposure may be building |
| Short cluster reached during rally | Falling | Negative or normalizing | Short covering may be reducing exposure |
| Long cluster reached during decline | Falling | Positive or normalizing | Long-side deleveraging may be underway |
These interpretations are conditional.
Positive funding does not prove that most contracts belong to longs, and rising open interest doesn’t reveal the direction of newly created positions.
Spot volume, liquidation records, and broader price structure are needed to build a more complete picture.
How to Analyze a Bitcoin Liquidation Heatmap Step by Step
Platforms such as CoinGlass and Hyblock offer liquidation heatmap tools with different exchange coverage, lookback periods, and model assumptions.
A practical analysis follows this sequence:
- Select the correct cryptocurrency and perpetual futures market.
- Check whether the heatmap covers a single exchange or multiple exchanges.
- Identify the current price and strongest nearby clusters.
- Compare cluster distances in percentage terms rather than dollars alone.
- Review whether the clusters have persisted or changed recently.
- Check open interest and funding rates for evidence of crowded positioning.
- Compare the levels with support, resistance, and spot trading volume.
- Monitor actual liquidations if price approaches a significant cluster.
Use consistent timeframes when comparing data.
A seven-day heatmap may reveal broader concentration zones that are absent from a twelve-hour view, but older estimates may also reflect positions that have since changed.
A longer lookback is not automatically more accurate.
Common Mistakes When Reading Liquidation Heatmaps
Three mistakes account for many misleading interpretations.
First, treating estimated liquidation values as confirmed executable orders. These are modeled exposures, not actual resting order-book liquidity.
Second, assuming the brightest cluster determines price direction. Large clusters can remain untouched, disappear, or become irrelevant as market conditions change.
Third, confusing a liquidation-driven spike with sustained buying or selling demand.
A short squeeze may lift prices rapidly, but the momentum can fade once forced buying is exhausted.
The same applies to downward liquidation cascades.
Heatmaps are more useful for identifying where volatility could accelerate than predicting where the market must trade next.
Frequently Asked Questions
What do bright colors mean on a crypto liquidation heatmap?
Bright colors generally indicate larger estimated concentrations of liquidation levels. The precise color scale and numerical meaning depend on the analytics provider.
Are liquidation heatmaps accurate?
They can help locate potential areas of leveraged-position stress, but the values are estimates. Providers cannot observe every trader’s exact collateral, leverage, or liquidation threshold.
Do liquidation clusters attract Bitcoin’s price?
They can coincide with areas where forced closures accelerate price movement. However, they do not guarantee that Bitcoin will reach those levels.
What is the difference between liquidation levels and support or resistance?
Support and resistance describe areas where buying or selling reactions have occurred or may occur. Liquidation levels estimate where leveraged positions could be forcibly reduced or closed.
Can liquidation levels disappear before price reaches them?
Yes. Traders can close positions, reduce leverage, add margin, or change collateral arrangements. Heatmap models can also update their estimates.
How do I identify a potential short squeeze?
Look for significant estimated short liquidation clusters above price, bearish derivatives positioning, a bullish price breakout, and evidence of short liquidations as the move develops.
Is a liquidation heatmap better than an order-book heatmap?
They serve different purposes. Liquidation heatmaps estimate future forced-position closures, while order-book heatmaps show currently posted limit orders. Using both can provide more context about leverage risk and available liquidity.
Can liquidation heatmaps predict market crashes?
No. They can reveal areas where forced selling might accelerate a decline, but they cannot reliably predict when a crash will begin or whether a particular cluster will be reached.